If you like maps and history of the US, you’ll likely find this STATISTICAL ATLAS
OF THE NINTH CENSUS (1870) fascinating. Even better, all the maps are available in 300 dpi (a 256mb download)! It’s fun, in map-geek way, to see what cities were listed and which were left out (Ex … Olympia Wa shown, Seattle Wa not)
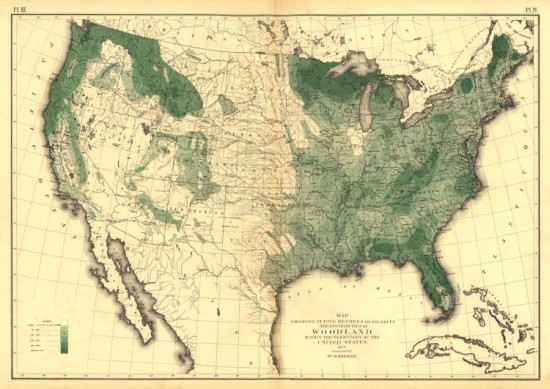
Below are a couple map examples. Click on the map to get a higher resolution version. The first map shows a mapping of the woodlands. At least in the western half of the US, with which I’m most familiar, I think that’s a pretty accurate assessment of how the woodlands appear today (though the trees are likely newer and shorter).
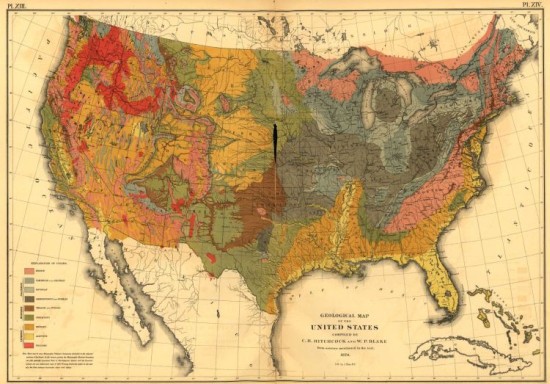
And here’s a geographical map:


